Onboarding project | Tactics
The Product
The what?
Urban Company
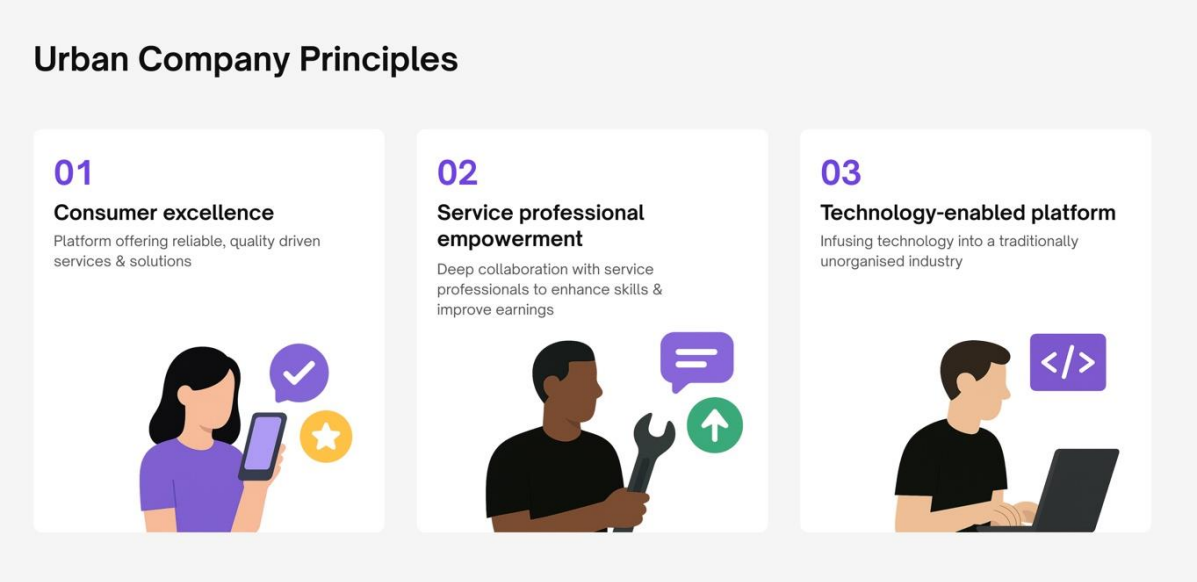
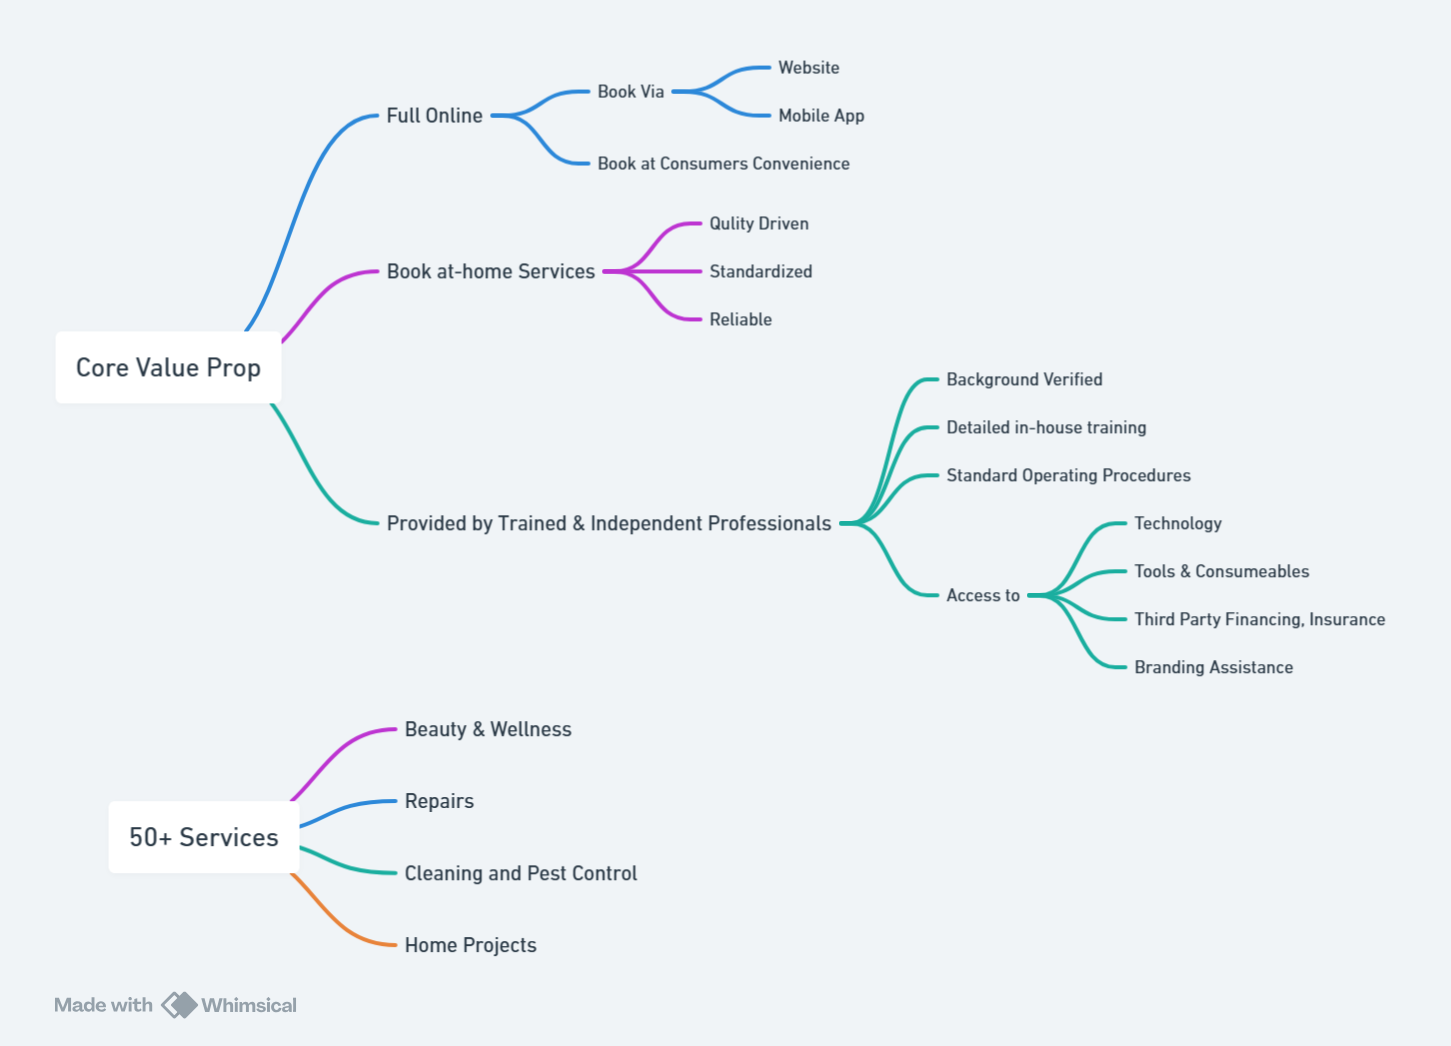
Urban Company operates a technology-driven, full-stack online services marketplace for quality driven services and solutions across various home and beauty categories.
They operate in 59 cities across India, United Arab Emirates (“UAE”), Singapore, and Kingdom of Saudi Arabia (“KSA”), of which 48 cities are in India, as at December 31, 2024.
Their platform enables consumers to easily order services, including cleaning, pest control, electrician, plumbing, carpentry, appliance servicing and repair, painting, skincare, hair grooming and massage therapy.
These services are delivered by trained and independent service professionals at the consumers’ convenience.
Their focus?
They are focused on enabling delivery of a quality driven, standardized and reliable service experience.
The How?
To achieve the above, they have engaged a select network of background verified independent service professionals, empowering them with comprehensive support. This includes detailed in-house training, established standard operating procedures, access to technology, tools and consumables, third party financing, insurance, and branding assistance. This approach enables the service professionals to improve their skills, enhance quality of service delivery and increase their earning potential.
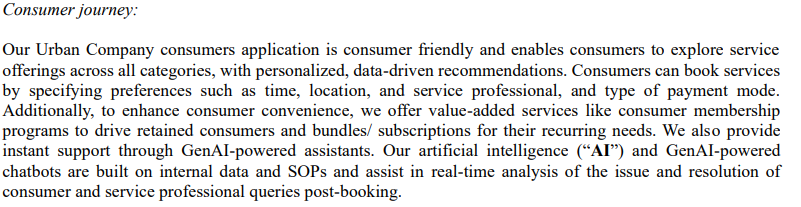
Consumer Journey
As outlined by the company
For Customer
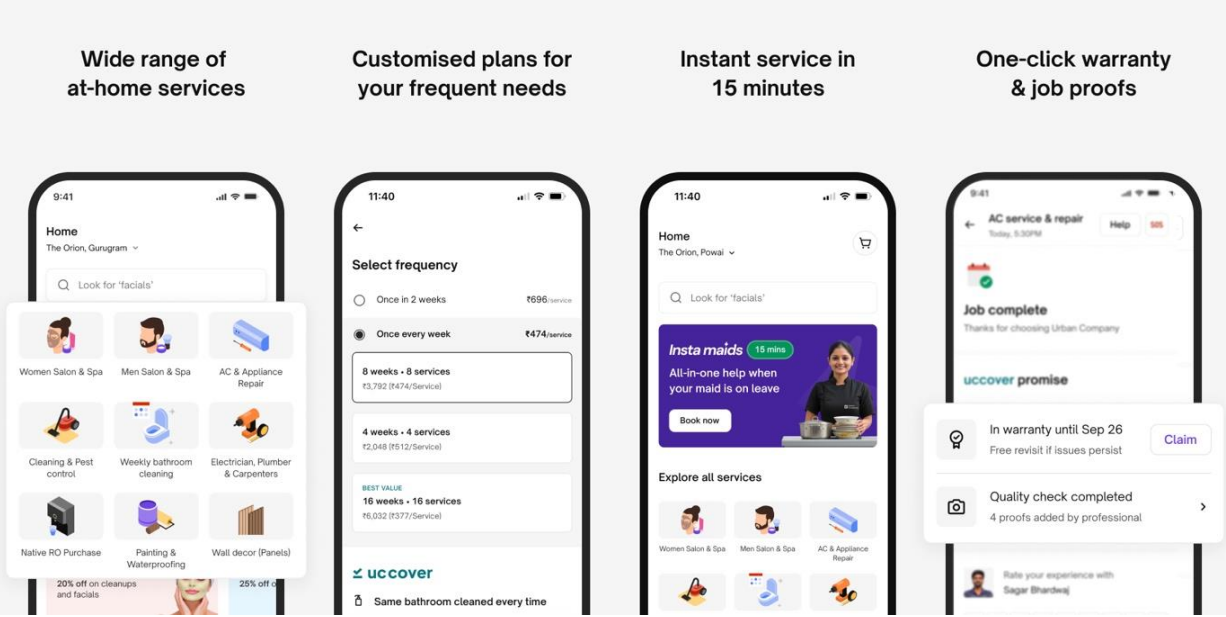
On Job Assistance & Quality Checks
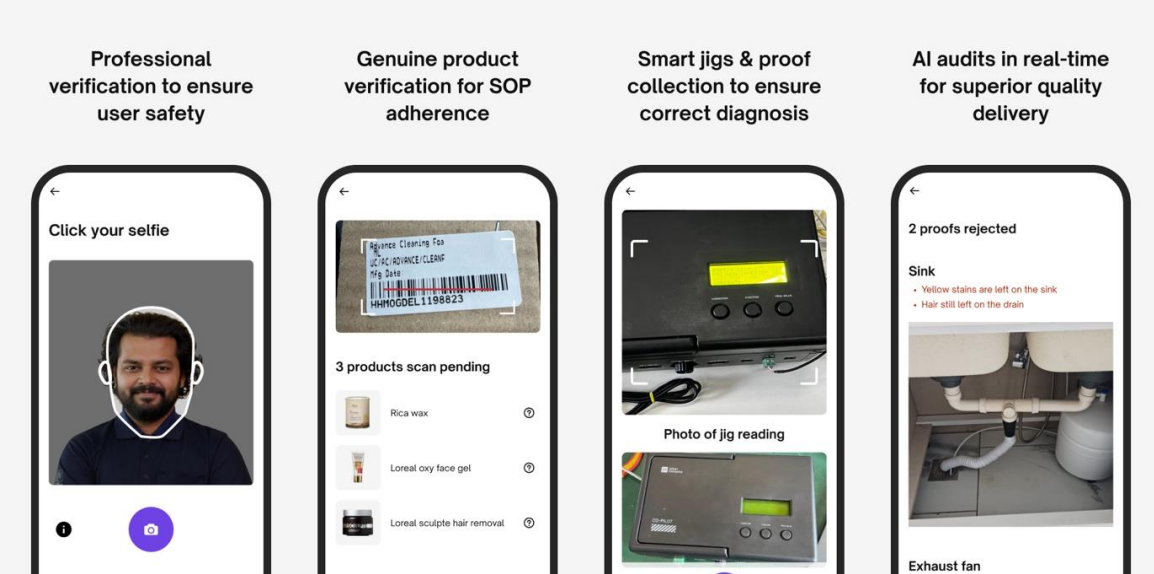
For Service Professional
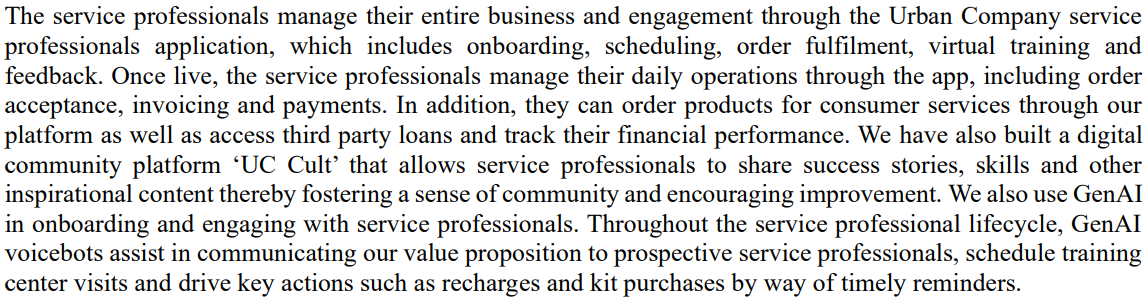
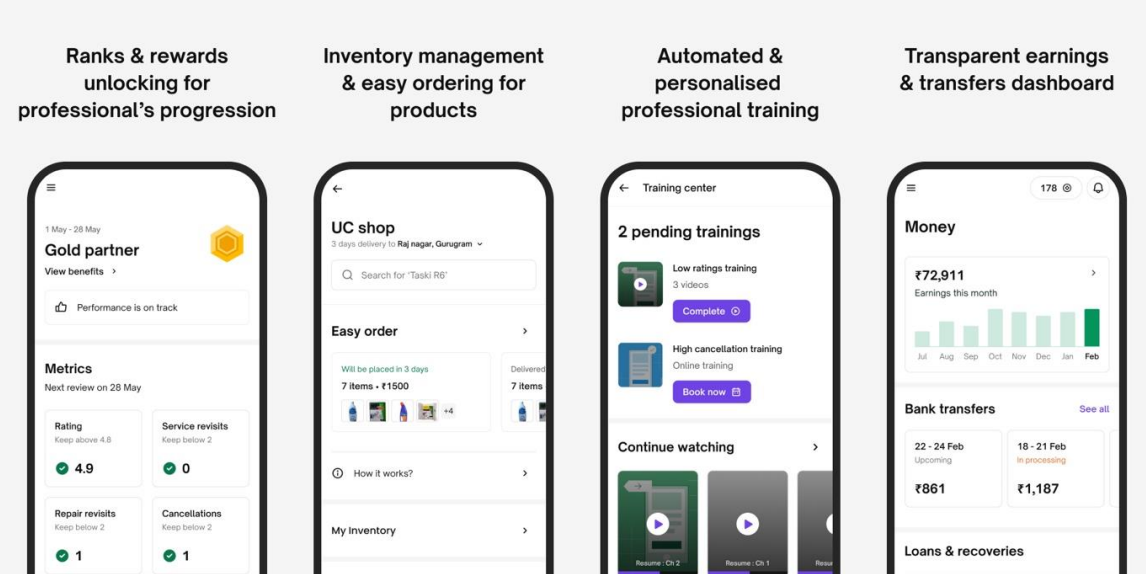
ICP's
The Who?
Criteria | User 1 | User 2 | User 3 | User 4 | User 5 |
Name | Deepthi | Priyanka | Suhas | Spurthika | Tabitha |
Age | 26 | 31 | 26 | 27 | 38 |
Occupation | CA at PwC | Home Maker | Accountant | Works at Cognizant | Teacher |
Staying Condition | Stays alone in 1 BHK, Bengaluru | Rented house (Stays with Husband + Kid), Bengaluru | Rented house (Stays with Wife), Bengaluru | Rented house (Stays with husband), Bengaluru | Rented house (Stays with Husband + 2 Kids), Hyderabad |
Time Vs Money | Time | Time | Money | Money | Time |
1st Booking (Year + Category) | 2022 (Bathroom Cleaning) | Nov 2021 (Salon Service) | Feb 2024 (Electrician) | Jan 2025 (Pedicure) | April 2021 (Salon) |
2nd Booking (Year+ Category) | 2023 (Salon Services) | Jan 2022 (Salon Service) | May 2024 (Plumber) | Jan 2025 (Plumber) | June 2021 (Salon) |
Gap between 1st & 2nd | 1 Year | 2 months | 3-4 months | 15-20 days | 2 Months |
Most Booked Category | Salon Services | Salon & Spa | Home Services | Salon Services | Home Services |
Feature most valued | Time slots available before office starts, ability to book the same service professional every time | Flexible time slots | Price is pre-determined & fixed, service professionals don't randomly charge you anything | Service professional assigned immediately, knew who was coming unlike Swiggy where the partner is assigned late | Breakdown of services into just a visit, installation, |
Frequency of booking (Current) | Every month | Every month | Only when home services are needed | Every other month | 1-2 time Quarterly |
Avg. Spend per Booking | 1500 - 1800 | 900 - 1200 | 150 to 300 | 500 - 1000 | 300 to 700 |
Max. Amount Ready to Spend for beauty service/month | Up to 2500 | 1500 | N/A | upto 1500 | up to 800 |
Most Used Applications | Instagram, Snapchat | Instagram | Instagram and Amazon | ||
Why book at-home service? (social, emotional, physical) | Lazy, doesn't want to wait at salons, comfort of home, Spender | Low Pricing, saves time, can rest after service like massage, Spender | Saver | Low pricing compared to beauty parlors, best for emergencies, Saver | Price transparency, spender |
How did they discover UC? | No recall | Word of Mouth | Word of Mouth | Cannot recall | |
No. of Services Booked till now (appx) | 30+ | 30+ | 5 to 6 | 10+ | 20+ |
AHA Moment | Pre-office opening time slots + Finding same person | Brought their own massage table and oil with music and candle. That was crazy | On time arrival of professional | Immediate booking, Service professional clean up their own mess, they bring everything needed for service | 2 attempts for original payment - 90 days warranty |
Dislikes | Prices have gone up compared to other apps like Yes Madam, Express service is not available always | Sometimes services are not good. No consistency in services and Express service is not always available | The min. cart value of 399. Can't add small services like fan cleaning which costs 49 per fan | Salon services for men not that good. | Price have gone up, slots not available |
ICP Prioritization
[Use this framework to prioritize your ICP's]
Criteria | Adoption Rate | Appetite to Pay | Frequency of Use Case | Distribution Potential | TAM ( users/currency) |
ICP 1 | Low | High | High | High | High |
ICP 2 | Moderate | High | High | High | High |
ICP 3 | Low | Moderate | Moderate | Moderate | Low |
ICP 4 | Low | Moderate | Moderate | Moderate | Moderate |
ICP 5 | Moderate | Low | Moderate | Moderate | Moderate |
ICP 1 and ICP 2 are clearly the winners because:
- ICP 1 ranks high in all the parameters. The TAM (extrapolated) is also high as the number of working women (23+ years) is high and they want assistance in home services or require flexible booking slots for services. If they like the service, the frequency of use case is also high and the word of mouth for these ICP's is high. They have not yet progressed into saving habit and are willing to spend.
- ICP 2 also ranks high in all the parameters. The TAM is also high as home makers or newly married wives or women who have moved to a new city for work/post marriage is high. As the husbands are working they prefer getting the work done from others without having to disturb their husbands again and again.
ICP 3, ICP 4 and ICP 5 have a moderate to lower appetite to pay and the frequency of use is also lower. Hence, we are not going to consider these.
Sources:
D1, D3 and D7 Retention
Disclaimer: As all the users are using UC for >60 days now, I have extrapolated the data for D1, D7 and D30 retention metrics based on user calls and their bookings.
D1 Action | D7 Action | D30 Action | User Status | LTV of Customer | |
|---|---|---|---|---|---|
ICP 1 (Deepthi) | Booked Bathroom Cleaning Service | None | None | Highly Active | 3 Years |
ICP 2 (Priyanka) | Booked Salon Services | None | None | Highly Active | 3.6 Years |
ICP 3 (Suhas) | Booked Electrician | None | None | Moderately Active | 1.3 Years |
IICP 4 (Spurthika) | Booked Pedicure Service | None | Booked Plumbing Service (D15) | Moderately Active | 4 Months |
IICP 5 (Tabitha) | Booked Salon Service | None | None | Highly Active | 4 Years |
DAU/MAU
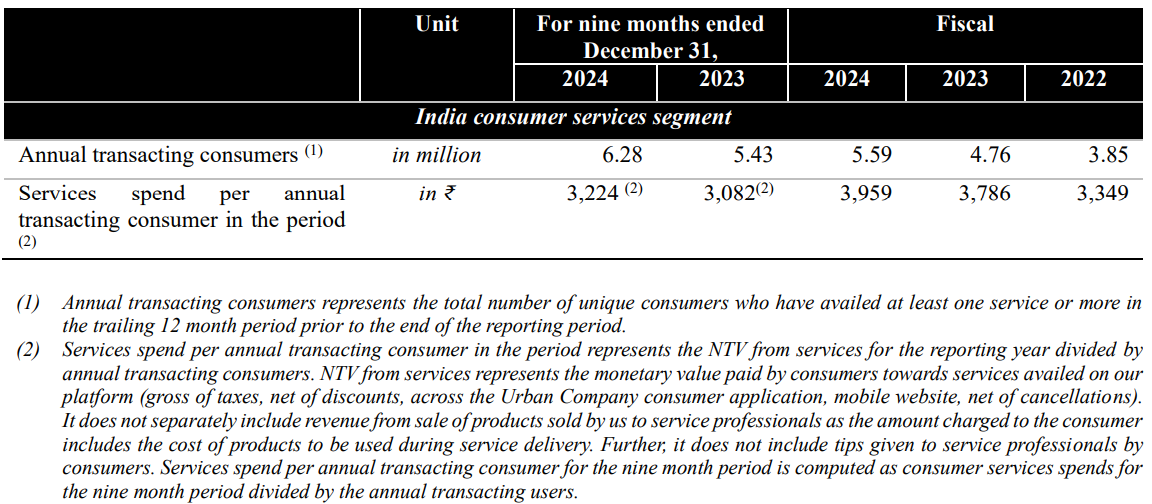
Although, there was no information on DAU and MAU, I found that UC has 6.28 million annual transacting customers and the service spend by an user is about INR 3,224.
Services spend per annual transacting consumer in the period represents the NTV from services for the reporting year divided by annual transacting consumers.
The service spend is within the range we found out from user calls. From my user calls, a user usually spends anywhere between 1500 to 2500 per service.
Retention
Consumer retention basis NTV for our business (excluding Native products)
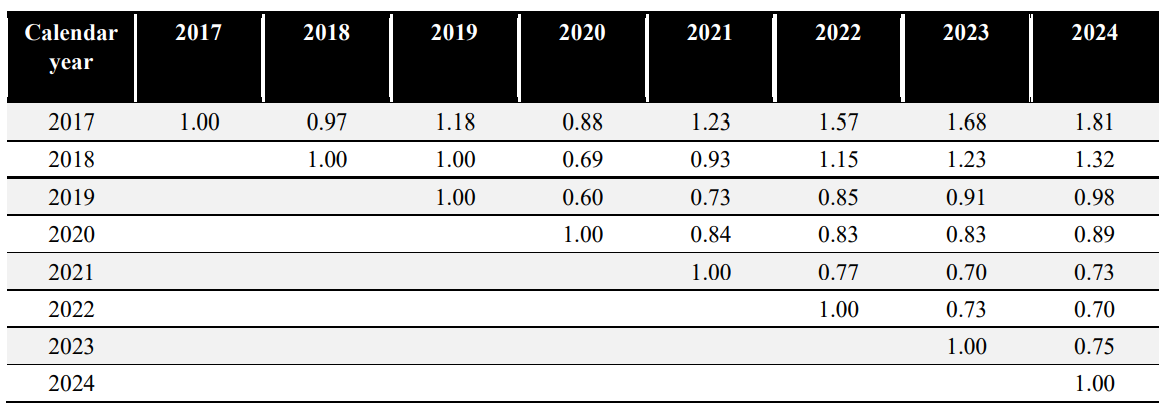 To be read from left to right, each calendar year (1st column) is a cohort.
Each cohort represents consumers who place their first order on UC platform in a given calendar year. For example, the cohort for calendar year 2017 includes all consumers that placed their first order on UC platform in calendar year 2017 and have collectively increased the NTV spend to 1.81 times by calendar year 2024.
As consumers utilize the services on UC platform more frequently, the NTV generated by each cohort has also grown over the periods indicating UC consumers’ propensity to spend more on UC platform with increasing habit formation tendencies.
Increase in Net Transaction Value (New Vs Retained Users)
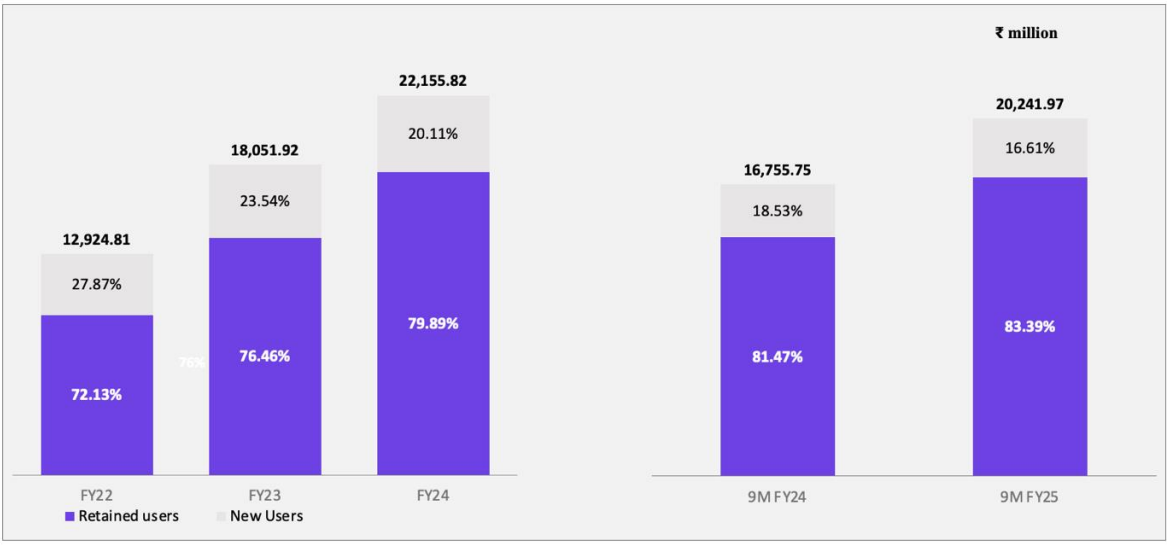
The NTV from retained users has been increasing steadily over the last 3 financial years.
This aligns with our user calls, I noticed that all the users except 1 new user have increased the frequency of order over the last 1-2 years as compared to the year in which they placed the first order.
Retained consumers lifetime category adoption by cohort
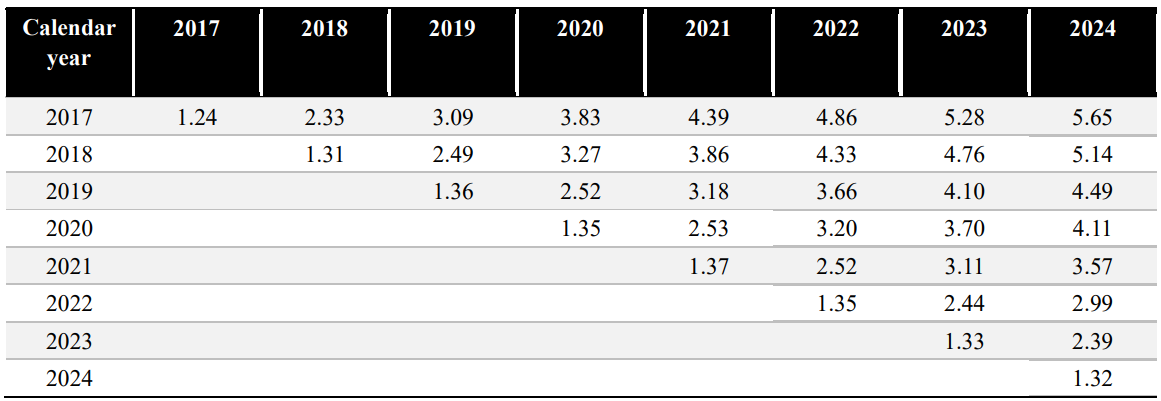
The above table shows that retained consumers show a consistent pattern of expanding service category use and engagement. The lifetime category adoption by UC's retained consumers exceeds five super categories by the end of their seventh year on the platform.
This aligns with the user calls and understanding their bookings. The users I spoke with have discovered and experienced other service categories in their 2nd booking itself. Although, only 1 user (Priyanka) has booked more than 4 categories, other users have booked up to 3 categories.
Breakdown of Reviews
A breakdown of the 50 recent reviews (within the last 30 days) taken from the Apple App Store. I have not taken reviews from the app directly as the app is managed by UC and the reviews/ratings can be skewed to the advantage of UC.
Negative reviews and ratings - 32
A staggering 64% reviews are less then 4 Stars with negative experience.
Category of Negative Review | Number of Reviews | Percentage to Negative Reviews | Percentage to 50 Reviews |
|---|---|---|---|
Service Quality (Incomplete service, not up to mark, damage done, work ethics) | 13 | 41% | 26% |
Ease of reaching Customer Support (AI Chat Bot) | 9 | 28% | 18% |
UI/UX (No bill generated, ease of booking, ease of refund/cancellation) | 7 | 22% | 14% |
Pricing | 3 | 9% | 6% |
Consumer Rating on the Platform (As per UC, given in their DRHP)
The following ratings were given by consumers to service professionals after the service. The ratings were taken on the UC app itself.
We focus on trust, reliability, quality, and convenience and take ownership of timely delivery and quality during the consumer’s service journey. This focus has enabled us to improve the average consumer rating given to service professionals on our platform over the period indicated in the table below: Page 231
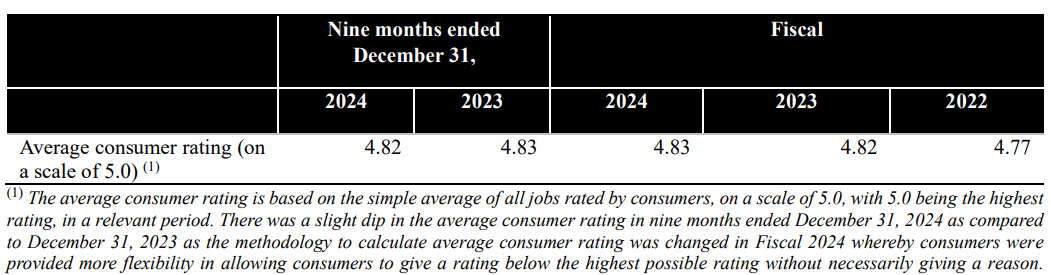
Although, UC boasts that a 4.82 rating in it's app for the financial year ended December 31, 2024, the ratings provided by users in the App Store tells a different story altogether.
A staggering, 64% users out the total pool of 50 reviews are not happy with the service. In this, 26% are not happy with the overall service, 18% are not happy with the after-sale support, 14% are not happy with the UI/UX of the app and 6% are not happy with the pricing.
Things that align/don't align with the user calls
- The users I spoke with are happy with the service professionals. Only 2-3 services were not up to the mark or were not identical in comparison with the same service experience from a different professional no UC.
- Only 1 user I spoke with had to reach out to customer support (Tabitha, for Pest Control as it did not work the first time), and the user did not complain about this as UC quickly resolved the issue. US under it's UC Promise gave a 90 days warranty where Tabitha can call the pest control expert as many times until the issue is resolved without paying anything extra.
- The users I spoke with were happy wit the UI/UX
- Almost all the users I spoke with are unhappy with the pricing on UC. They say the pricing has increased and they are preferring other service providers like Yes Madam over UC.
Hypothesis
Hypothesis | Reason | |
|---|---|---|
Hypothesis 1 | 1 service booked within 12 hours of signing up | UC users are high-intent as they are looking either for a home service expert or a beauty expert in a given time frame. Why? Because, both home and beauty services cannot be delayed. Home services if delayed cause functional issues at home and beauty services if delayed cause time commitment issues. A user needs these services at the exact moment they need them, it could be either after a few hours, tomorrow or day after. If the onboarding has been simple and quick, with the Core Value Propositions being shown on each step and re-assuring the customer that the professionals are actually professionals the user will book their 1st service quickly. Ideally, if the user books the service within 12 hours, then the user has trusted UC and wants to experience the service. |
Hypothesis 2 | 500 spent in first 30 days | Although, UC provides services that start from 49 INR, from my user calls, I noticed that users are comfortable spending up to 500 INR for home services and up to 1000 for beauty services. If there is a home service, the cost generally tends to go up to 500 as the parts needs repair or replacement. Cash is king, and receipt of revenue confirms that the onboarding was successful and the customer was happy with the service. The customer did not ask for refund. This metric solidifies that acquisition has happened. |
Hypothesis 3 | 2 service categories booked in first 60 days | UC has 2 core service categories* - Home and Beauty. After experiencing the first service, it is imperative that the user books a second service in another category, this could be out of curiosity to try or necessity. But fundamentally, the driving factor should be the 1st experience. Now, that the user has experienced how UC works and how the professionals are, the user need not have as much reservation as in the first booking. The 2nd booking confirms that the user has moved from a new user to a potential active user as the habit formation would begin. From the user calls as well, I noticed that users tend to book the 2nd service within 60 days of the first service, and usually in another category. This is an important activation metric |
Footnotes
- *Given in the DRHP
Since UC has over 6.28 million users, it is in the mature scaling stage. And hence, we are going to validate with the following:
- Impact on Retention
- Impact on Referral/WoM
- Impact on LTV
Hypothesis 1 | Hypothesis 2 | Hypothesis 3 | |
|---|---|---|---|
Retention Impact | Low | Medium | High |
Referral Impact | Medium | High | High |
LTV Impact | Medium | Medium | High |
Summing up
Hypothesis 3 is a better activation metric as it enables UC to understand weather or not the customer had a positive experience or a negative experience from the first booking.
From the user calls, I have noticed that most users make the second booking only after 2-4 weeks.
Why is this? As the core offerings of UC is 'Home' and 'Beauty' services, these services are not frequently used by a consumer. Even more so, when the consumer lives alone without a family (cannot book for other members). These services are not required on a day to day or week-to-week basis.
Home services is even more infrequent. If a user had booked Beauty or Home as their 1st booking then there is a greater probability of them re-booking Beauty services within the next 30 days than booking a home service.
Hence, the 2nd booking becomes even more imperative to track retention.
Beauty services are generally booked every month. So retention and habit building can only be tracked from 2nd month.
Moreover, the second booking, solidifies that the user has completely experienced the Core Value Proposition of UC and is satisfied. The user has also experienced the AHA moments, that is the on-time arrival, flexibility of time slots, trained professionals bring everything and do not create a mess.
In App Teardown
Key
- Green Triangle - What's working well
- Red Triangle - What's not working well
- Blue Triangle - Suggestions to Improve
- Purple Circle - Cognitive Bias
- Pink Oval - AHA Moment
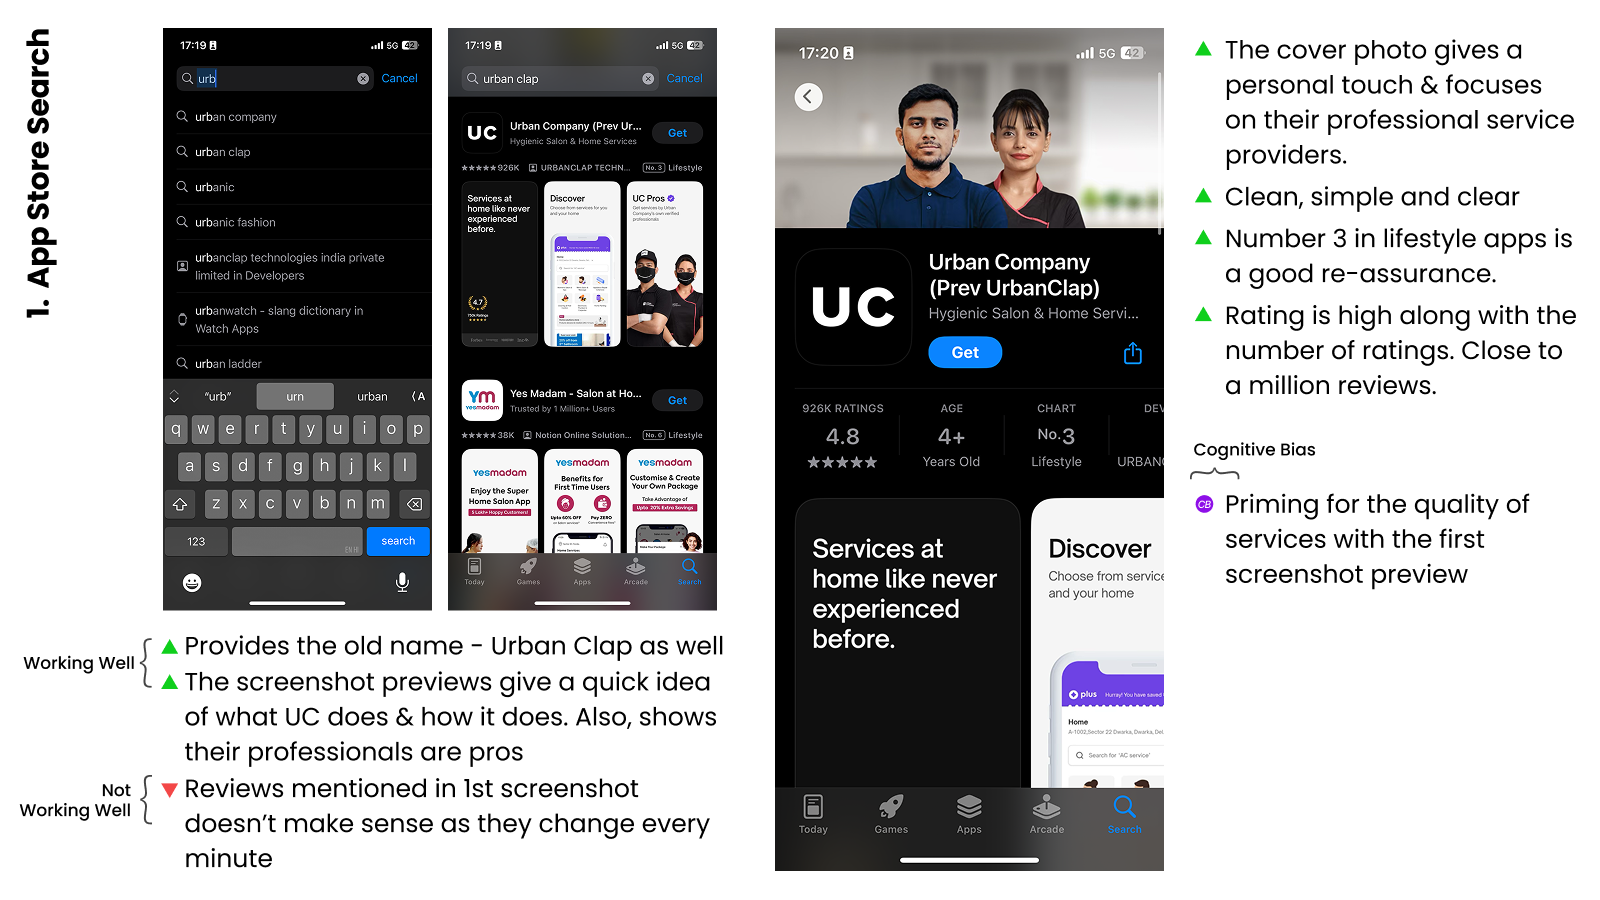
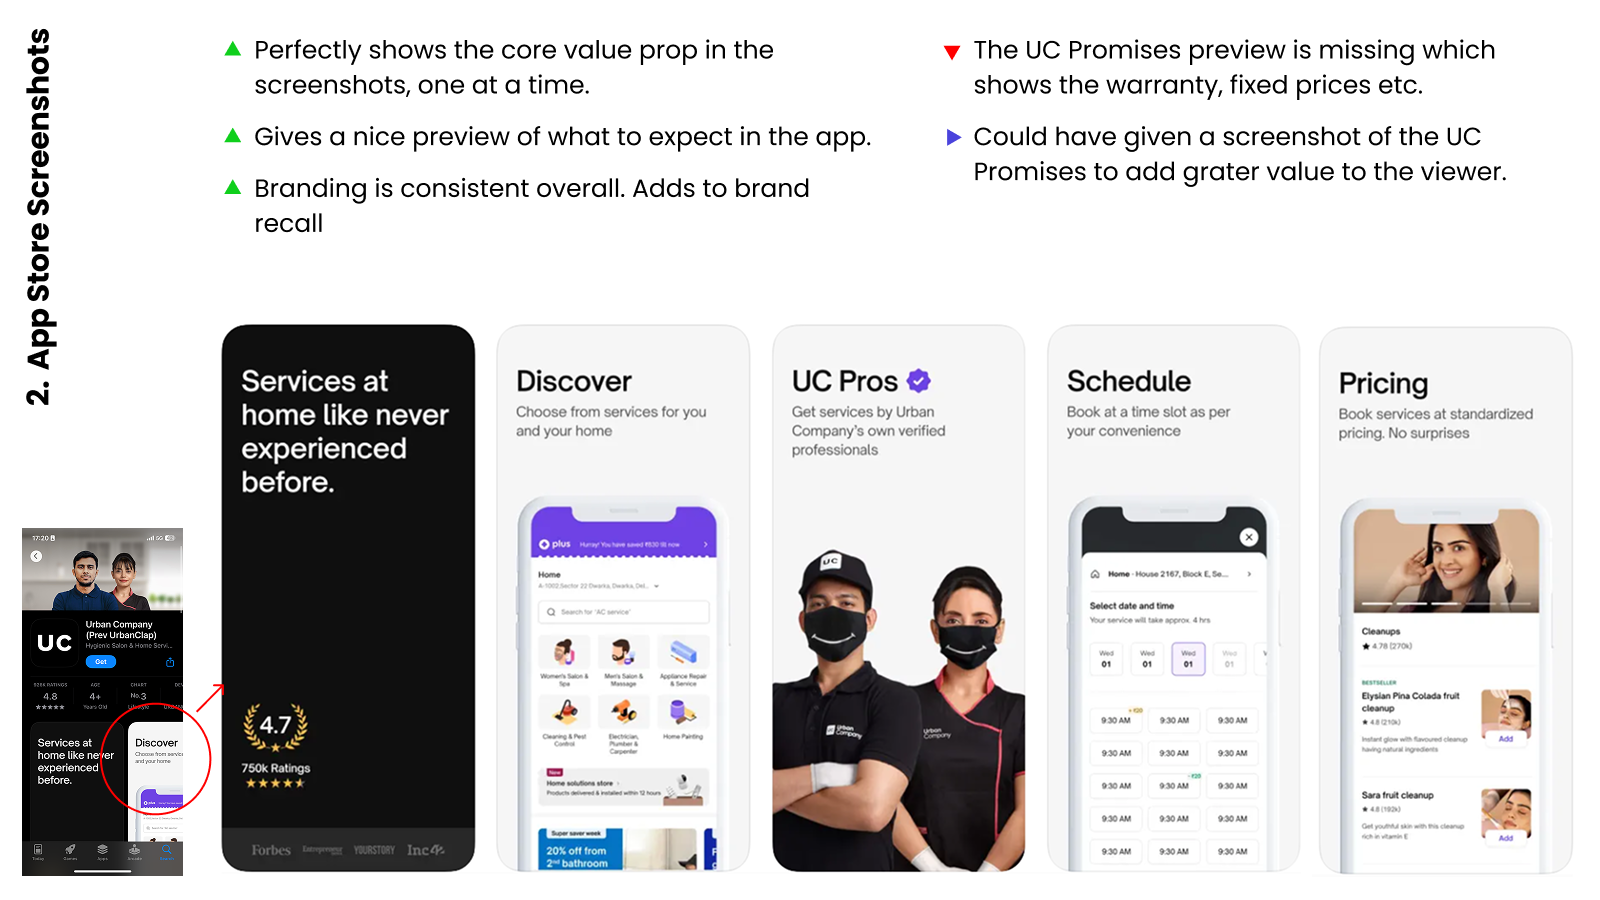
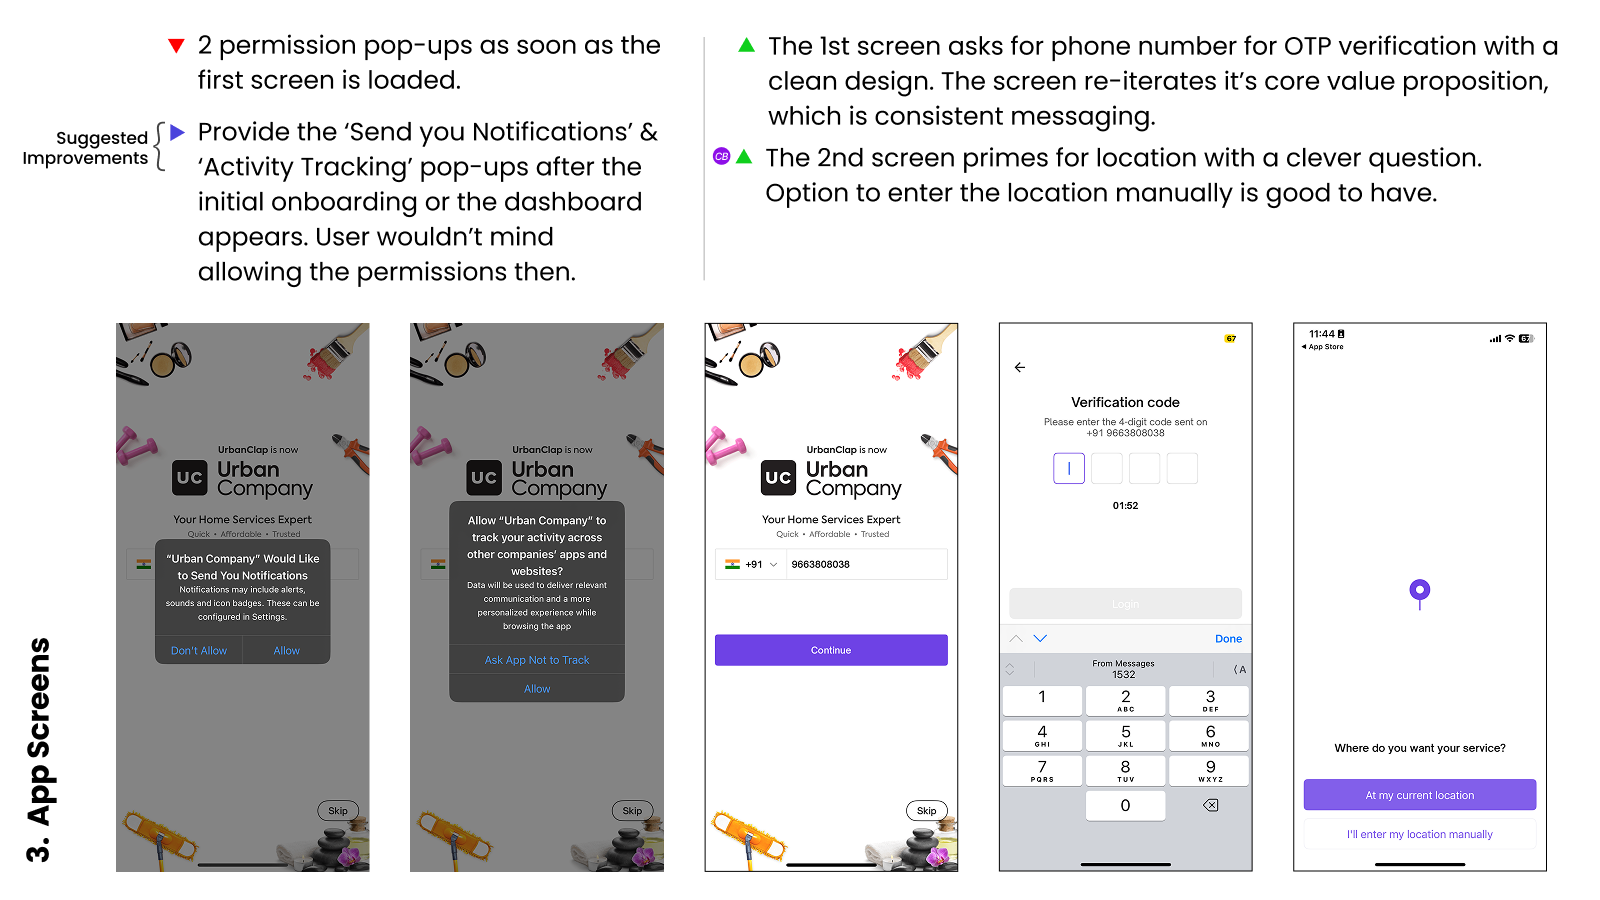
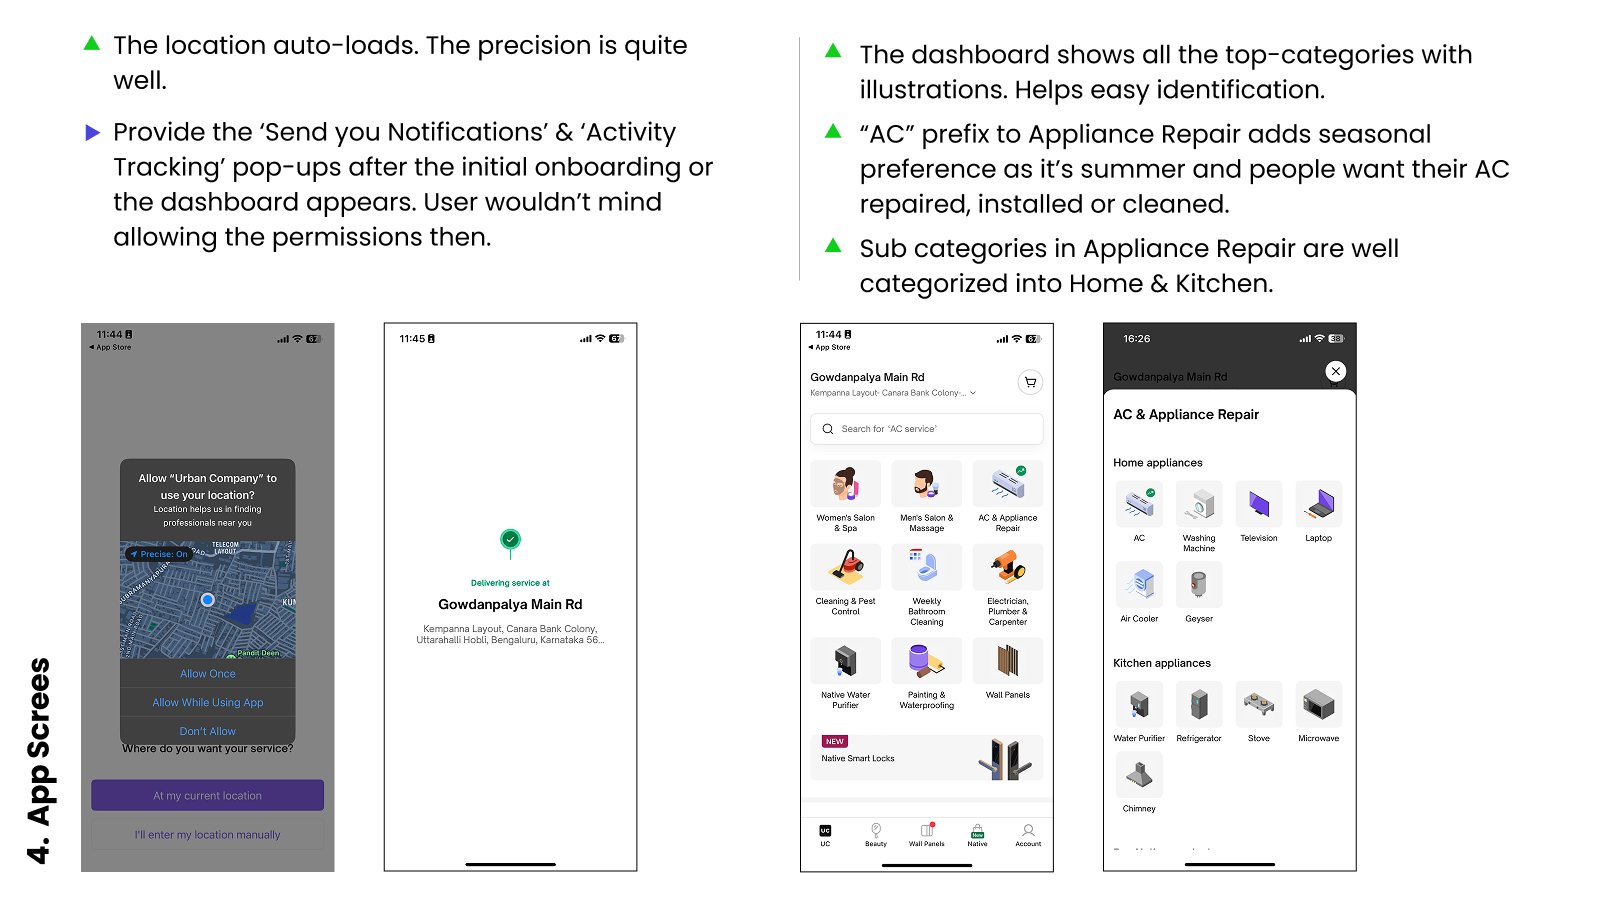
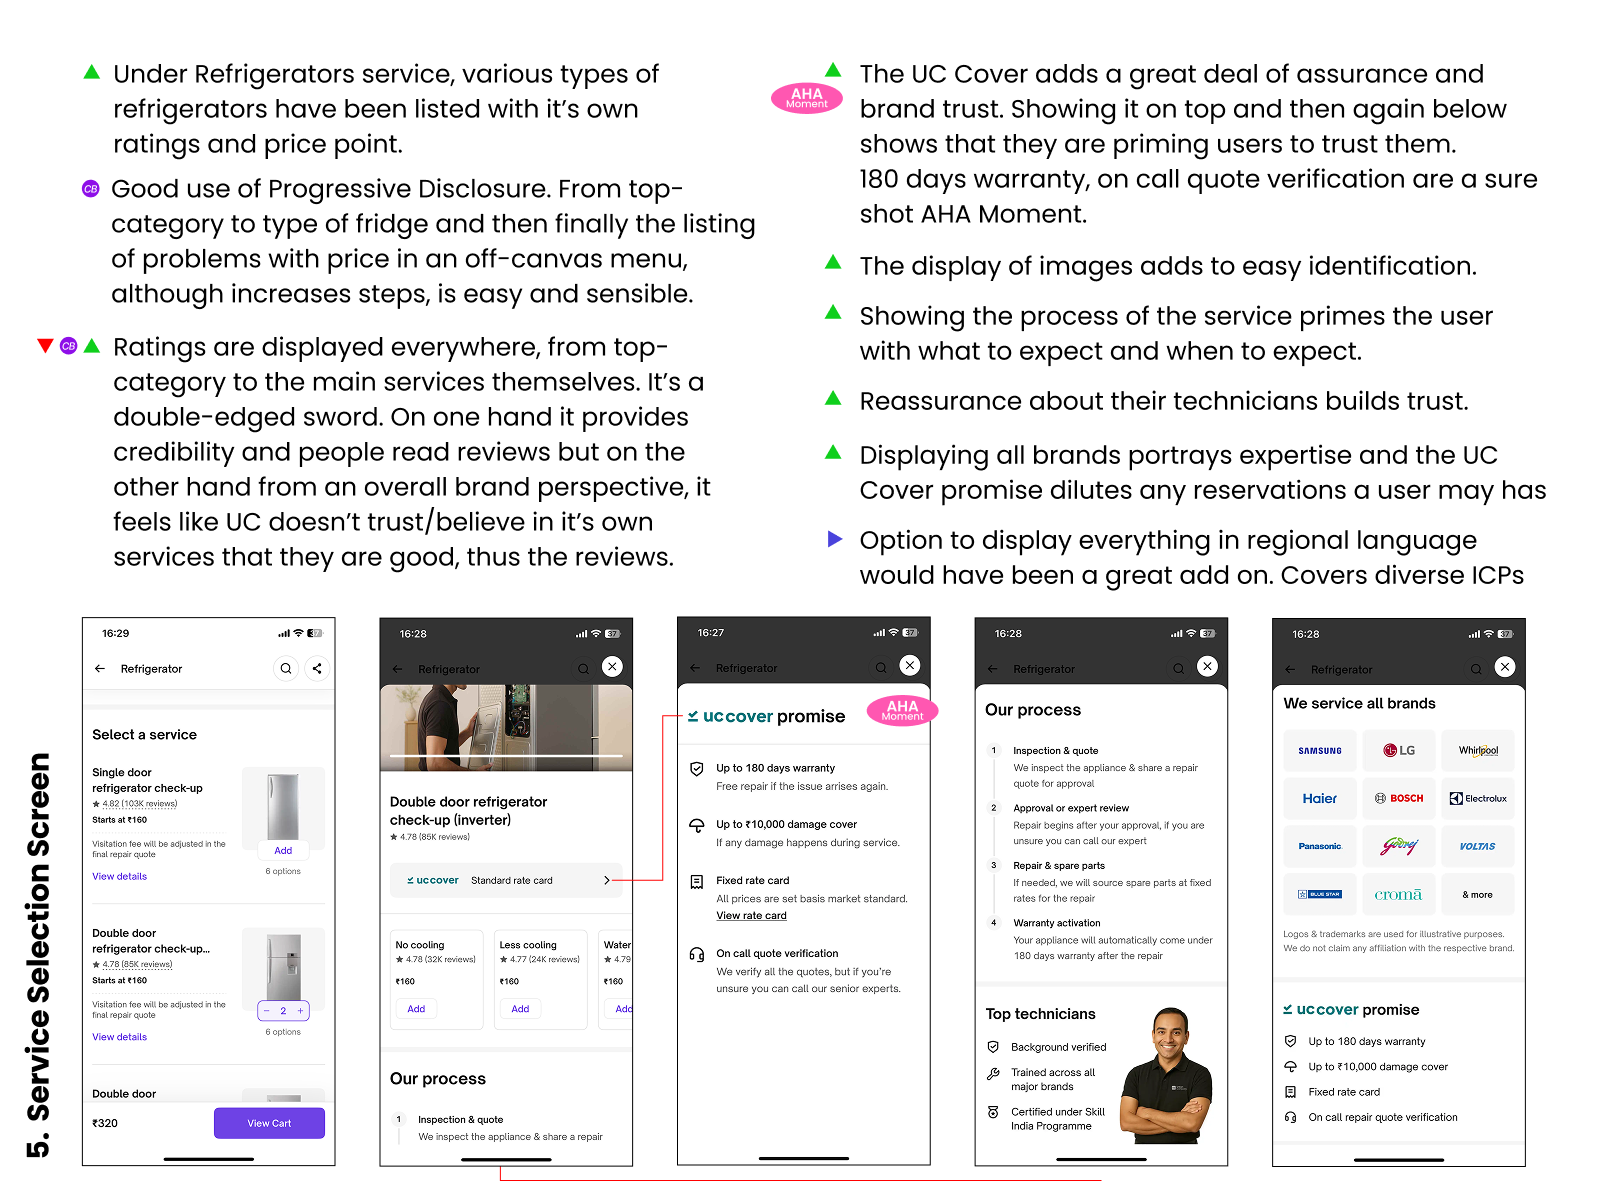
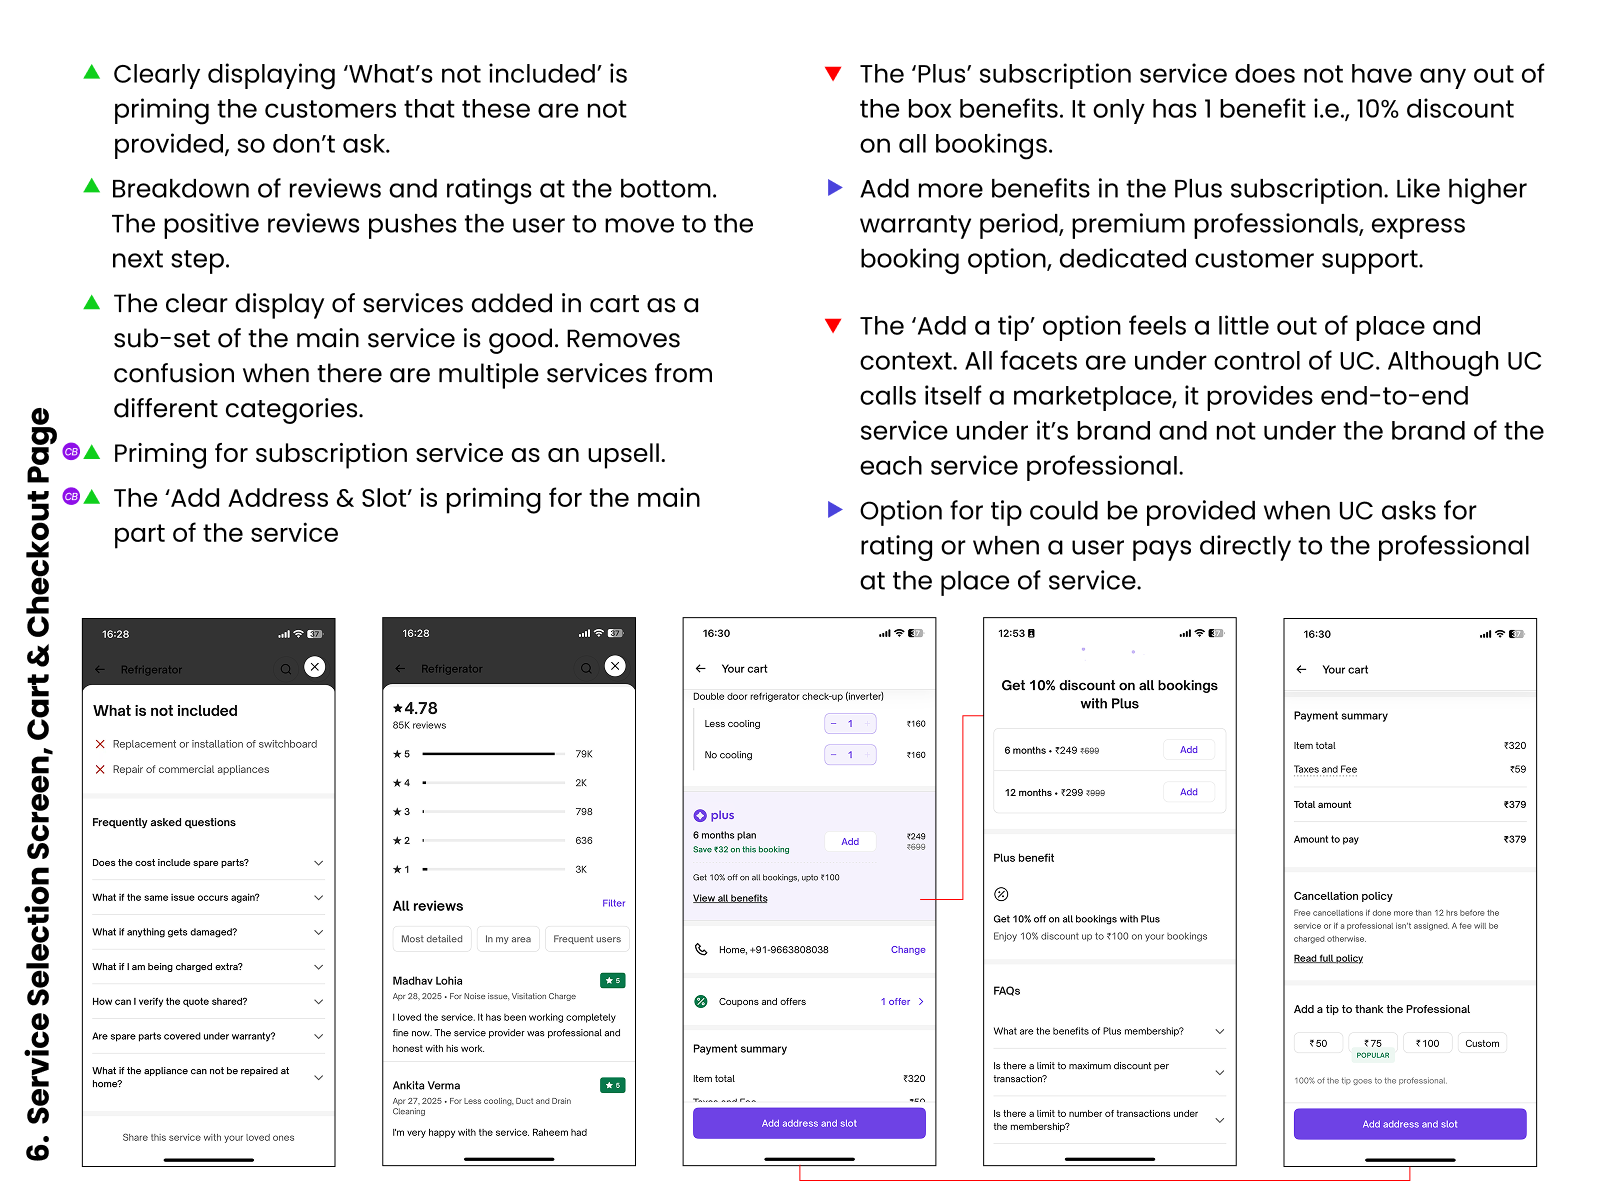
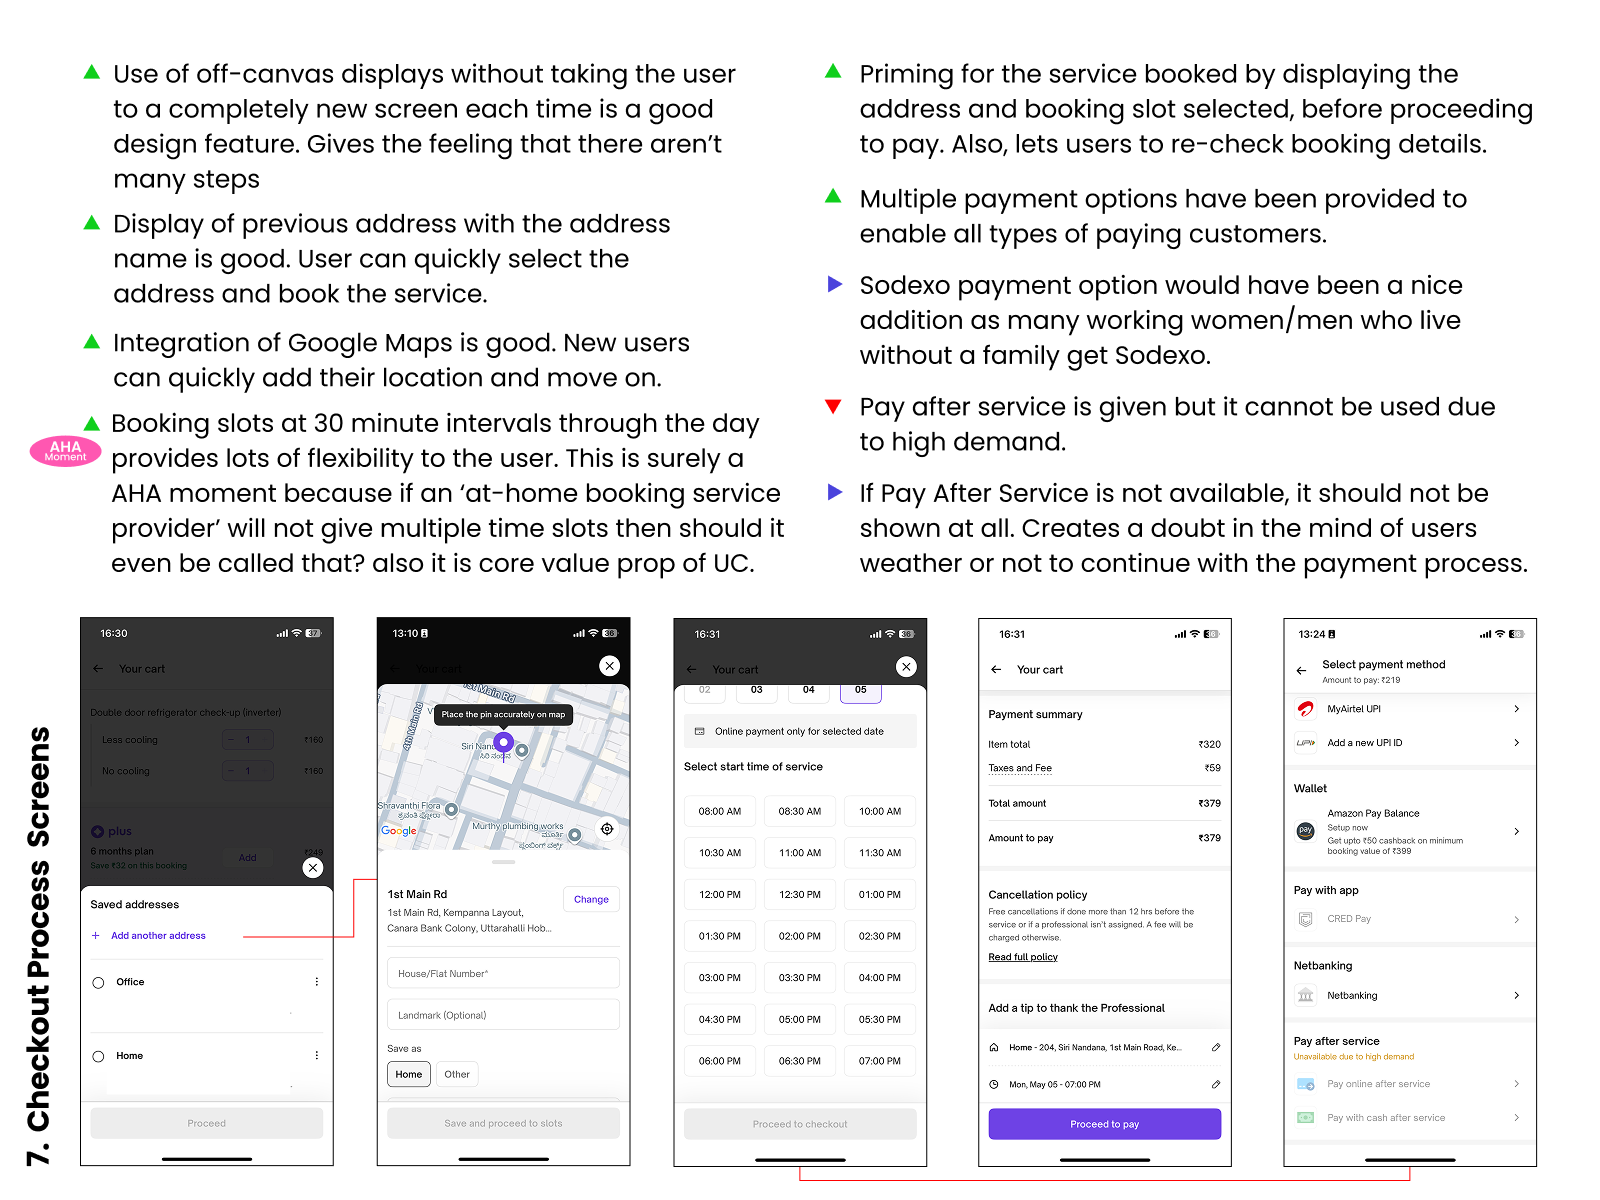
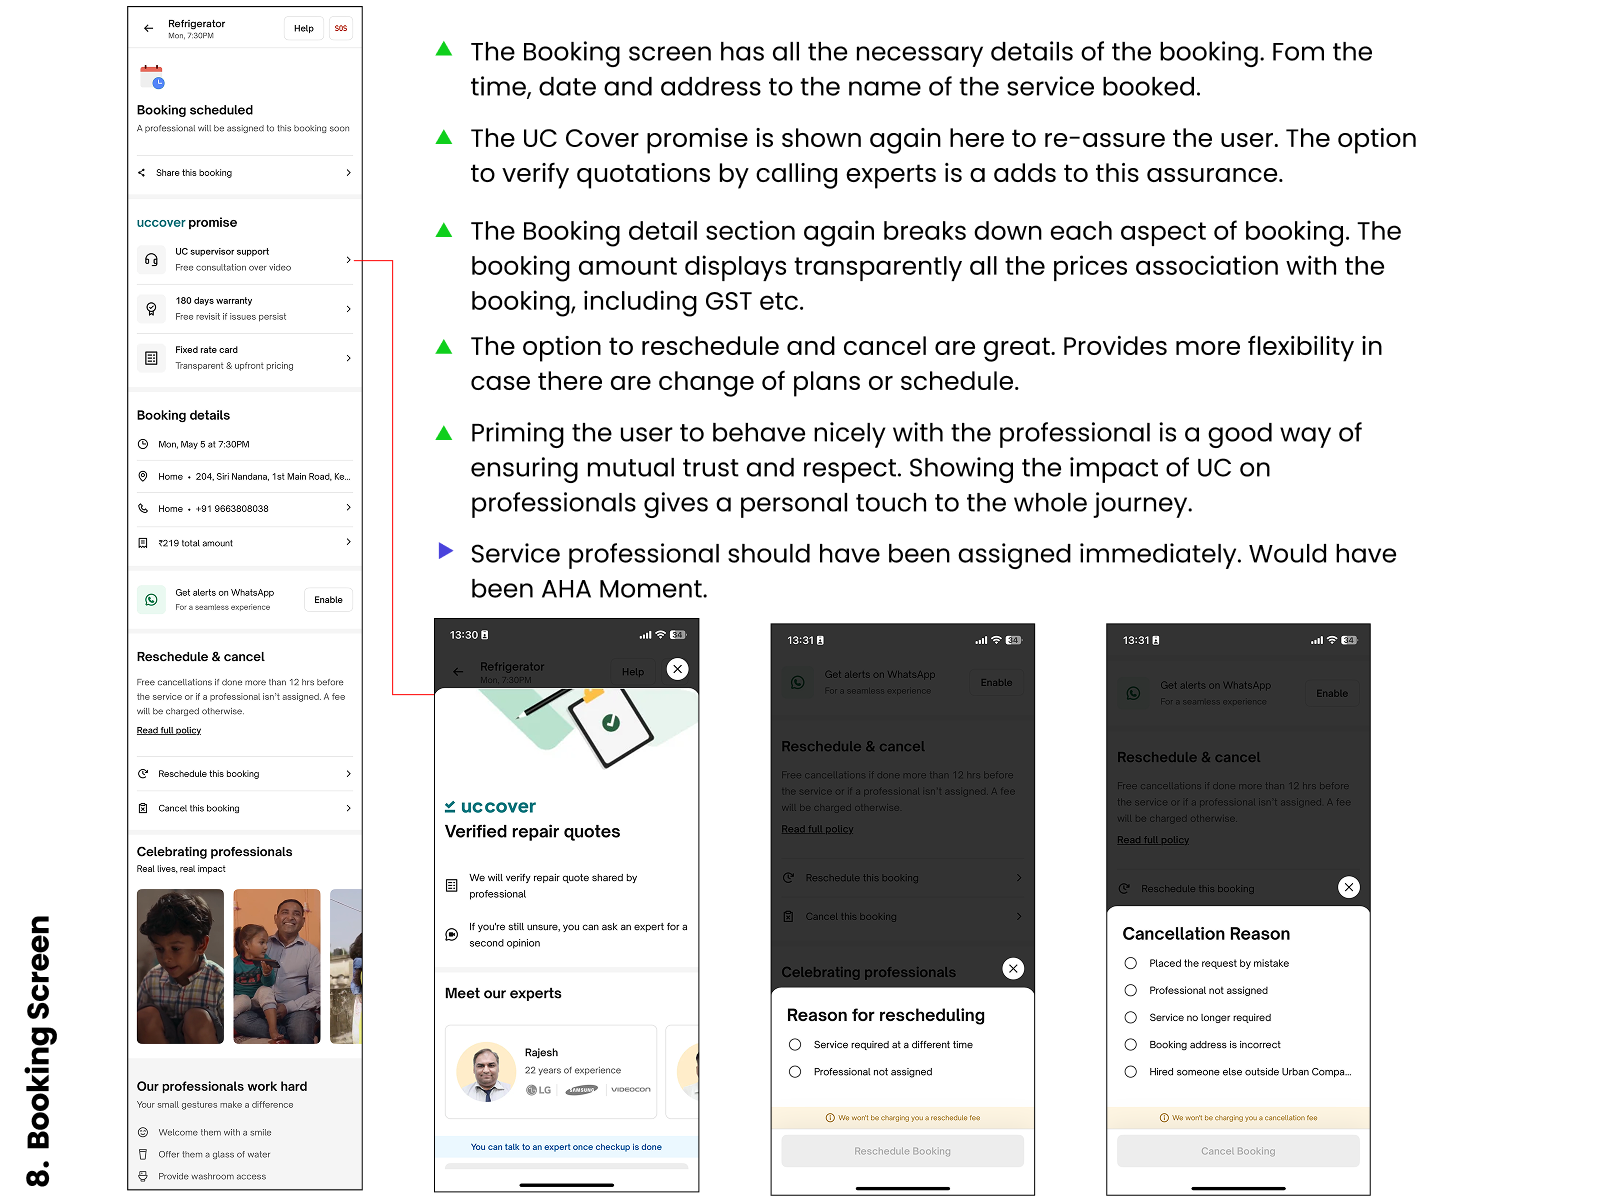
Cognitive Bias Observations:
- The UC booking journey uses Reciprocity Bias extensively by showing the Core Value Propositions at each step of the journey like the UC Cover Promises and Customer Ratings.
- The display of ratings at every screen also enables the Bandwagon Effect which says that "Users tend to adopt beliefs in proportion of others who have already done so". Looking at 1000's of ratings, the user is tempted to go ahead and book the service.
- Given the amount of services and the categories, UC cleverly overcomes the Hicks Law, which tells that more options lead to harder decisions. UC doesn't overload the customers with all the sub-category and takes them .
- It uses Empathy Gap to tell end-users to be nice to the professionals as many users don't even think about how the professionals feel.
- On the home dashboard and the final booking screen, UC has a section dedicated to their Professionals and their life, as though UC has taken a social responsibility to better their lives. This is Nobel Edge Effect, which tells that users tend to prefer socially responsible companies.
- The default address selection hints of Default Bias which says that 'users tend to stick with pre-selected options rather than making changes'
Off-line Teardown
AHA Moments
- The service professional arrived on-time +/- 5 minutes. He had called before coming to confirm the location.
- Had brought everything to help him carry out the work. All the customer did was watch and tell him the problem.
- The service professional cleaned up after providing his service.
Disclaimer: The above AHA Moments are based on the user calls as I was not present in a location where UC operates at the time of competing this project.
Brand focused courses
Great brands aren't built on clicks. They're built on trust. Craft narratives that resonate, campaigns that stand out, and brands that last.


All courses
Master every lever of growth — from acquisition to retention, data to events. Pick a course, go deep, and apply it to your business right away.





Courses
Built by Leaders From Amazon, CRED, Zepto, Hindustan Unilever, Flipkart, paytm & more





Crack a new job or a promotion with ELEVATE
Designed for mid-senior & leadership roles across growth, product, marketing, strategy & business




Learning Resources
Browse 500+ case studies, articles & resources the learning resources that you won't find on the internet.

Patience—you’re about to be impressed.